- Published on
An exploration of Polynomial Interpolation
- Authors
-
-

- Name
- Eduardo Escoto
- Ph.D. Student at UC San Diego
-
Interpolating Polynomials
! pip install numpy matplotlib --quiet
import numpy as np
from matplotlib import pyplot as plt
The Lagrangian Form of
Given the data points in the table below, we can use the lagrangian form to get a second-degree polynomial which we can use to estimate our unknown function, .
The Lagrangian form of is written as
Where is defined as
Thus we have : is the interpolating polynomial.
Using to approximate
Plugging in into our polynomial from above gives:
Which we can visualize in the graph below for our given data, and test point at .
x = np.linspace(-5,6, 1000)
points = [(0,1),(1,1),(3, -5)]

p_2 = lambda x: -(x**2) + x + 1

fig, ax = plt.subplots(figsize = (9, 6))

ax.plot(x, p_2(x), color = "black", alpha = .5, linestyle="--", label="$x^2$")
ax.scatter(*zip(*points), color = "red", label="Given Data")
ax.scatter(2,p_2(2), color = "green", label="Test Point")
ax.legend()
ax.set_title("$P_{2}$, Given Data, and Test Point");

Lebesgue Interpolation
We can prove that
where is the interpolating polynomial of at the nodes is the best approximation of , in the supremum (infinity) norm, by a polynomial of at most , and is the Lebesgue constant, i.e. , where
Of which we can write some python to evaluate the Lebesgue function (2) associated to a given set of pairwise distinct nodes .
def equidist_x(n):
    return np.array([-1 + k*(2/n) for k in range(n+1)])
def cheby_x(n):
    return np.array([np.cos((k*np.pi)/n) for k in range(n+1)])

def LagrangeCoeff(X, j):
    # Gets jth element
    x_j = X[j]
    # Removes the jth element so we can use vectorize operations
    X = np.delete(X,j)
    # Returns a function to be evaluated at the function value
    return lambda x: (np.prod(x - X))/(np.prod(x_j-X))

def LebesgueFunction(X, vectorized = True):
    # Creates all of the l_js
    LAGCoeffs = np.array([LagrangeCoeff(X, i) for i in range(len(X))])
    LebFunc = lambda x: np.sum([np.abs(LAG(x)) for LAG in LAGCoeffs])

    if vectorized:
        return lambda X: np.array([LebFunc(x) for x in X])
    else:
        return LebFunc

def plotL_n(x_j, L_n, ax = None):

    if ax is None:
        fig, ax = plt.subplots(figsize = (6,4))

    n_e = 1000
    n = str(len(x_j)-1)
    x_points = equidist_x(n_e)
    y_points = L_n(x_points)
    max_Lambda = np.max(y_points)
    Title = "Max $\Lambda_{" + str(n) + "}=" + str(max_Lambda) + "$"
    ax.plot(x_points, y_points, label = "$L_{"+str(n) + "}$")
    ax.hlines(y = max_Lambda, xmin = -1,xmax = 1,
              linestyle = "--", alpha = .5, label="$|| L_{"+str(n) + "}||_{\infty}$")
    ax.legend()
    ax.set_title(Title)
    return (ax, max_Lambda)
If we consider the equidistributed points for . We can plot (evaluate at a large number of points to have a good plotting resolution, e.g. with ) for . And then estimate for these three values of .
N = [4, 10,20]

fig, ax = plt.subplots(len(N), figsize = (14,10))
fig.subplots_adjust(hspace=.5)

for i, n in enumerate(N):
    x_j = equidist_x(n)
    L_n = LebesgueFunction(x_j)
    ax[i], max_l = plotL_n(x_j, L_n, ax[i])
    print("The max for n = " + str(n) +" is "+ str(max_l))
The max for n = 4 is 2.207824277504
The max for n = 10 is 29.898141093562177
The max for n = 20 is 10979.243923985841

Where we see that for the equidistant nodes above, that the Lebesgue constant is being defined by the behavior at the edges of our range.
Lebesgue Interpolation with Chebysheve Nodes
If we instead repeat the above for the Chebyshev nodes . We can see different behavior of and with those corresponding to the equidistributed points.
N = [4,10,20]

fig, ax = plt.subplots(len(N),figsize = (14,10))
fig.subplots_adjust(hspace=.5)

for i, n in enumerate(N):
    x_j = cheby_x(n)
    L_n = LebesgueFunction(x_j)
    plotL_n(x_j, L_n, ax[i])
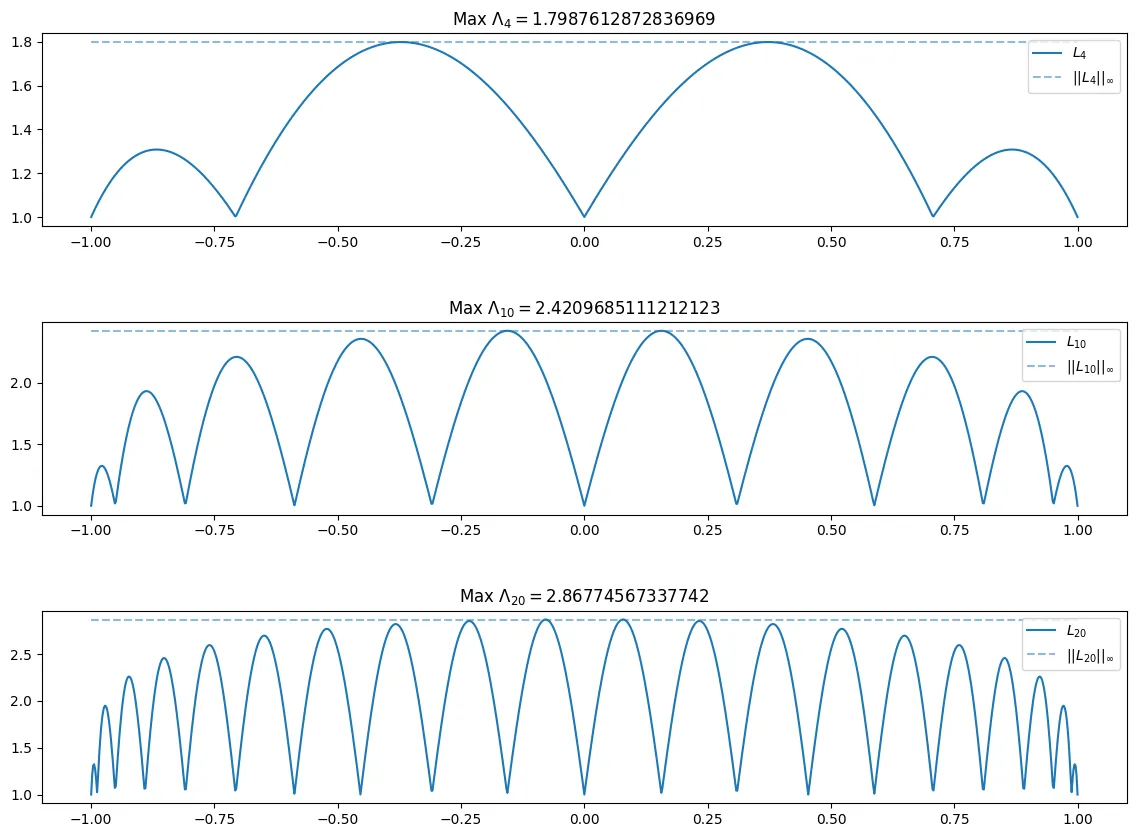
As can be seen above, the Chebyshev nodes seem to obtain their max close to zero as n increases, however, with the equidistant nodes, the max seems to be acheived closer to the bounds of the interval, namely near or . Additionally tends to grow much faster with the equidistant nodes, where with the Chebyshev nodes, it grows much slower.
Interpolating Arbitrarily distributed Nodes
We can use the Barycentric Formula for evaluating the interpolating polynomial for abritrarily distributed nodes
def BaryWeights(X):
    n = len(X)
    l = np.empty(n)
    for k in range(n):
        l[k] = 1 / np.prod(X[k] - X[np.arange(n) != k])
    return l

def BaryFormula(X, F_x, l=None , vectorized = True):
    n = len(X)
    N = len(x)
    l = BaryWeights(X) if l is None else l

    def BaryFunc(x):
        p = 0
        # Compute quotient of weighted sums
        z = x - X
        j = np.count_nonzero(z == 0)
        if j != 0:
            p = F_x[z == 0]
        else:
            mu = l / z
            p = np.sum(mu * F_x) / np.sum(mu)
        return p

    if vectorized:
        return lambda points: np.array([BaryFunc(x) for x in points], dtype='object')
    else:
        return BaryFunc
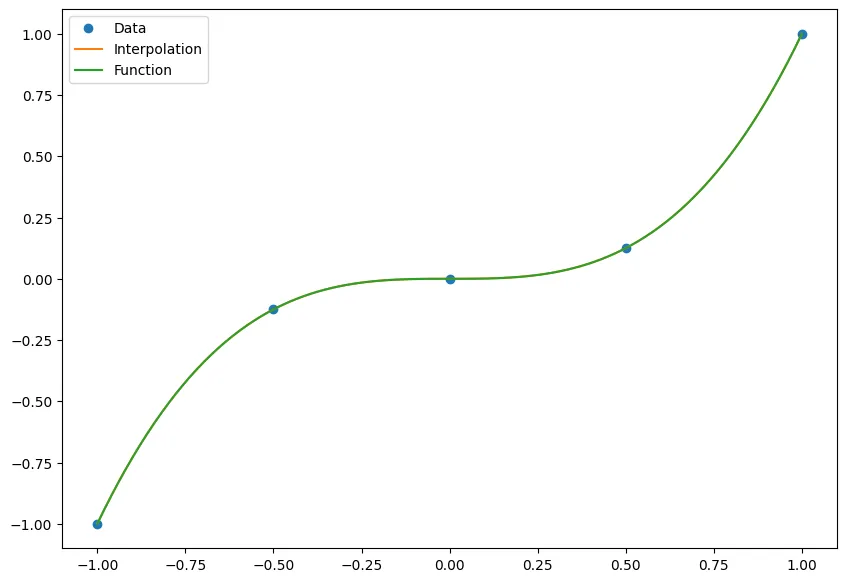
Here we test it with just a regular degree 3 polynomial!
nodes = np.linspace(-1, 1, 5)
data = nodes**3
points = np.linspace(-1, 1, 100)
p = BaryFormula(nodes, data)

fig, ax = plt.subplots(figsize = (10,7))

ax.plot(nodes, data, 'o', label='Data')
ax.plot(points, p(points), '-', label='Interpolation')
ax.plot(points, points**3, '-', label='Function')
ax.legend();
Consider the following table of data
Here we show what the function looks like from our interpolation!
nodes = np.array([0,.25,.52,.74,1.28,1.50])
data = np.array([0,0.7070,1,0.7071,-0.7074,-1.0])
points = np.linspace(-.5, 2, 100)

p = BaryFormula(nodes, data)

fig, ax = plt.subplots(figsize = (10,7))

ax.plot(nodes, data, 'o', label='Data')
ax.plot(points, p(points), '-', label='Interpolation')
ax.legend();
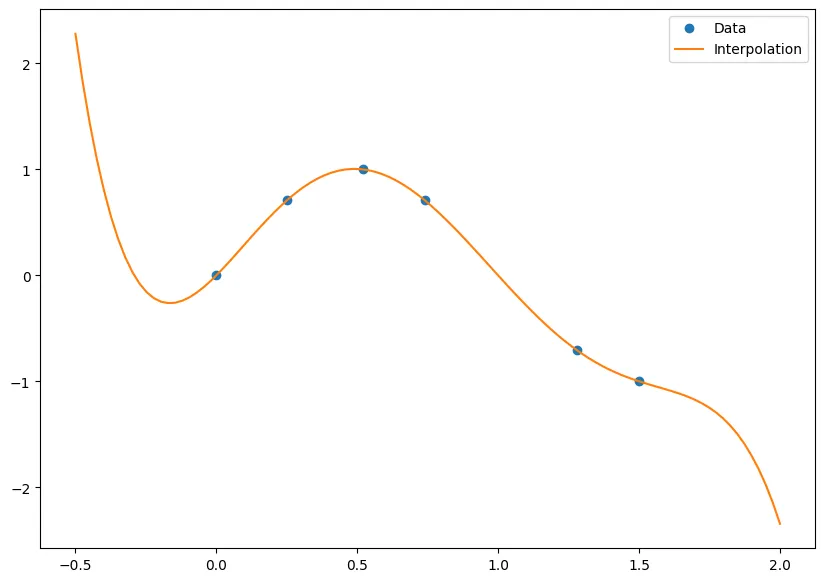
And the interpolation of is
(BaryFormula(nodes, data, vectorized = False))(2)
-2.343829608172828
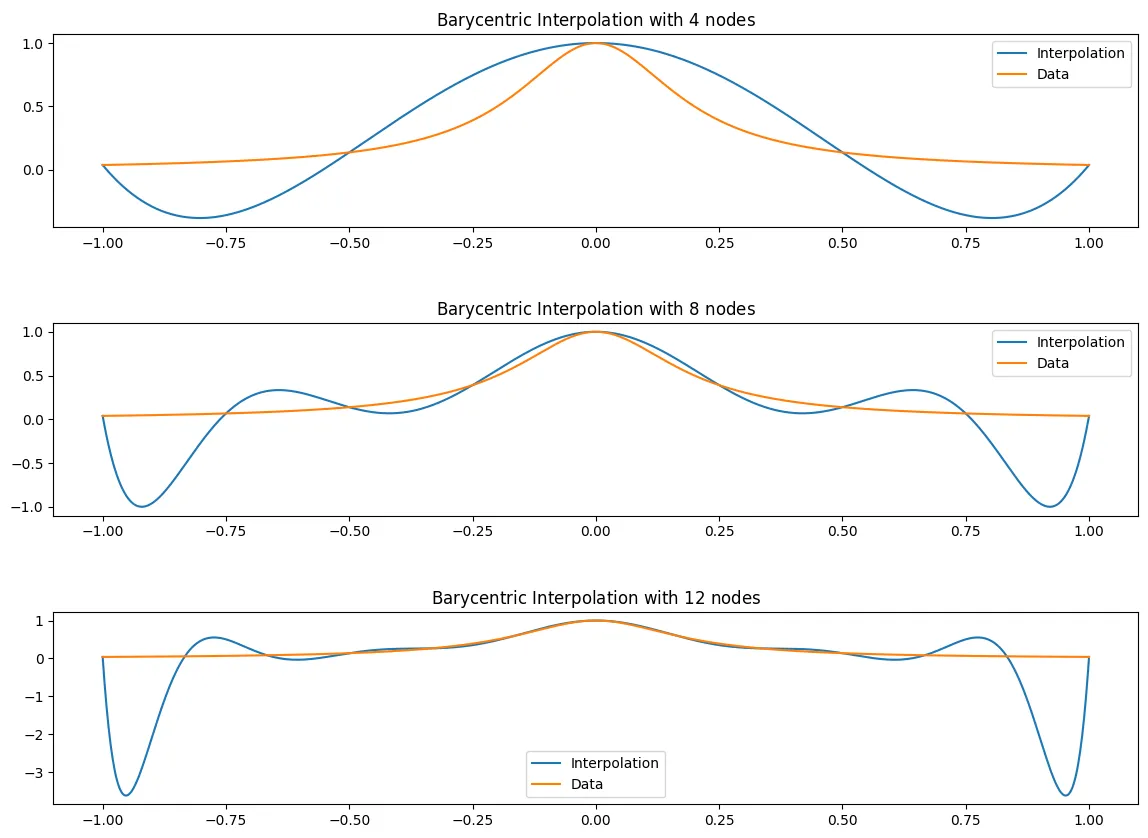
The Runge Example
Let
And lets interpolate with both:
(a) The equidistributed nodes for .
(b) The Chebyshev nodes for .
Where we use the barycentric weights for the equidistributed nodes
and for the Chebyshev nodes we can use
def plotB_n(x_j, B_n, f_x, ax = None):

    if ax is None:
        fig, ax = plt.subplots(figsize = (6,4))

    n_e = 1000
    n = str(len(x_j)-1)
    x_points = equidist_x(n_e)
    y_points = B_n(x_points)
    max_Lambda = np.max(y_points)
    Title = "Barycentric Interpolation with $" + str(n) + "$ nodes"
    ax.plot(x_points, y_points, label = "Interpolation")
    ax.plot(x_points, f_x(x_points), label = "Data")
    ax.legend()
    ax.set_title(Title)
    return ax
f_x = lambda x: 1/(1+25*(x**2))
def EquidistantBaryWeights(X):
    from scipy.special import comb
    n = len(X)
    return np.array([((-1)**j)*comb(n-1, j) for j in range(n)])
N = [4,8,12]

fig, ax = plt.subplots(len(N),figsize = (14,10))
fig.subplots_adjust(hspace=.5)

for i, n in enumerate(N):
    x_j = equidist_x(n)
    f_x_j = f_x(x_j)
    l = EquidistantBaryWeights(x_j)
    B_n = BaryFormula(x_j, f_x_j, l = l)
    plotB_n(x_j, B_n, f_x, ax[i])
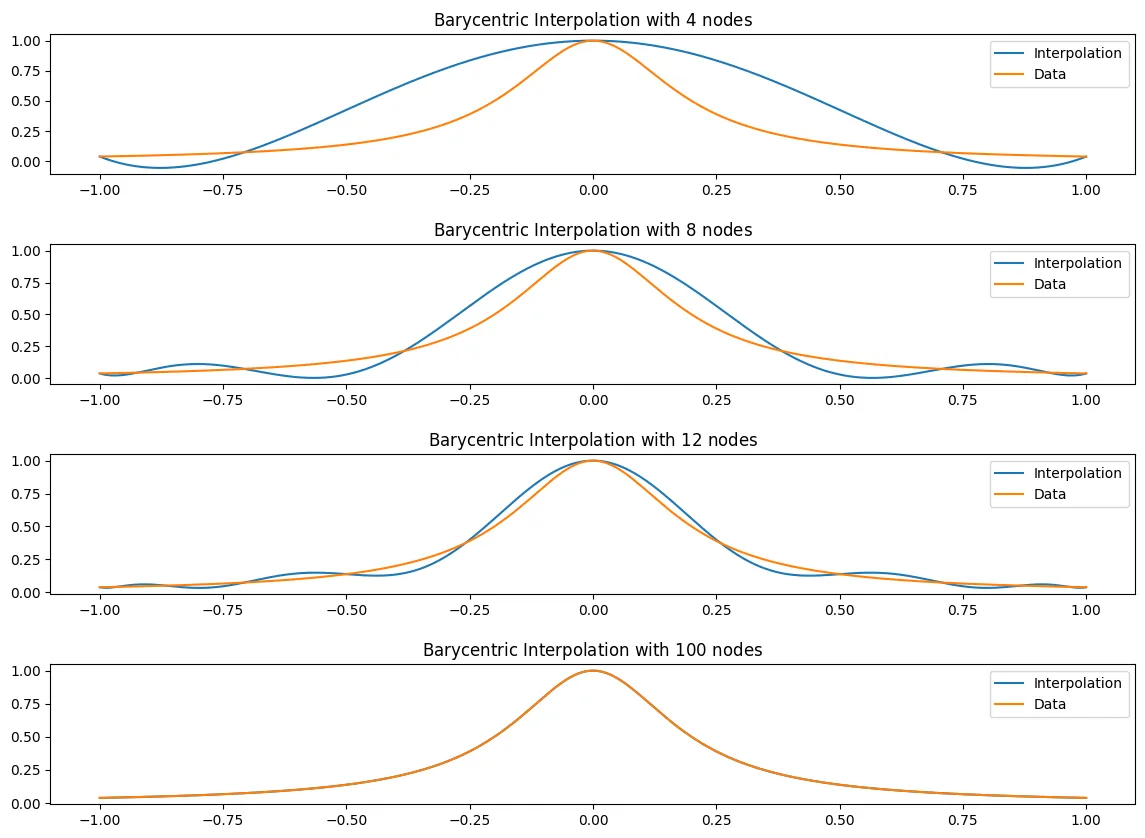
Chebyshev Nodes
The Chebyshev nodes for .
def ChebyBaryWeights(X):
    n = len(X)
    l = np.array([float((-1)**j) for j in range(n)])
    l[0] = l[0]/2
    l[-1] = l[-1]/2
    return l
N = [4,8,12, 100]

fig, ax = plt.subplots(len(N),figsize = (14,10))
fig.subplots_adjust(hspace=.5)

for i, n in enumerate(N):
    x_j = cheby_x(n)
    f_x_j = f_x(x_j)
    l = ChebyBaryWeights(x_j)
    B_n = BaryFormula(x_j, f_x_j, l = l)
    plotB_n(x_j, B_n, f_x, ax[i])
Error analysis
Plotting the error for (a) and (b)
e_n = lambda x, f_x, B_n: f_x(x)-B_n(x)

N = [4,8,12]

fig, ax = plt.subplots(len(N),figsize = (14,10))
fig.subplots_adjust(hspace=.5)

for i, n in enumerate(N):
    x_j = cheby_x(n)
    f_x_j = f_x(x_j)
    l = EquidistantBaryWeights(x_j)
    n_e = 1000
    x_points = equidist_x(n_e)
    B_n = BaryFormula(x_j, f_x_j, l = l, vectorized=True)
    ax[i].plot(x_points, e_n(x_points, f_x, B_n), label = "error")
    ax[i].set_title("Error with $" + str(n) + "$ nodes")
    ax[i].hlines(0, -1,1,linestyle = "--", alpha = 0.6, color = "red", label = "$y=0$")
    ax[i].legend()
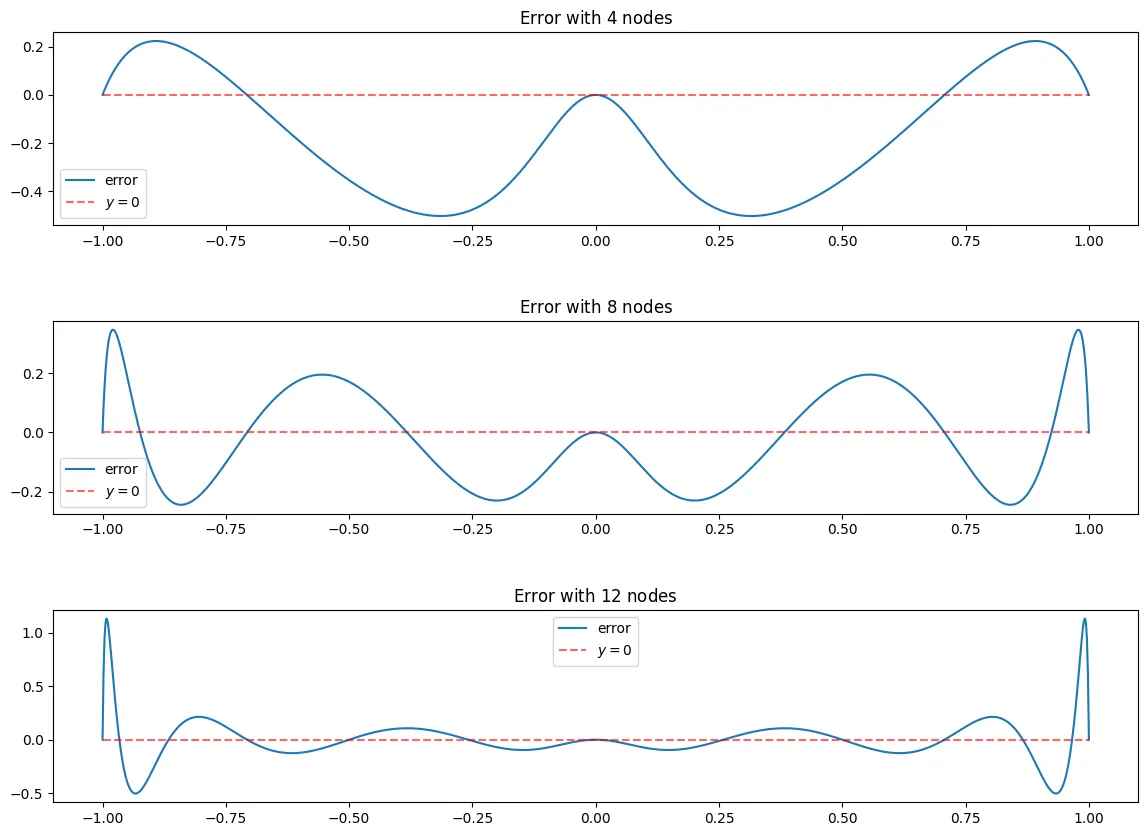
In the above graphs you see that the error is very small around which is what we would expect as seen in the graph above, the equidistant nodes tend to be very close to the function using Barycentric interpolation.
e_n = lambda x, f_x, B_n: f_x(x)-B_n(x)

N = [4,8,12, 100]

fig, ax = plt.subplots(len(N),figsize = (14,10))
fig.subplots_adjust(hspace=.5)

for i, n in enumerate(N):
    x_j = cheby_x(n)
    f_x_j = f_x(x_j)
    l = ChebyBaryWeights(x_j)
    n_e = 1000
    x_points = equidist_x(n_e)
    B_n = BaryFormula(x_j, f_x_j, l = l, vectorized=True)
    ax[i].plot(x_points, e_n(x_points, f_x, B_n))
    ax[i].set_title("Error with $" + str(n) + "$ nodes")
    ax[i].hlines(0, -1,1,linestyle = "--", alpha = 0.6, color = "red", label = "$y=0$")
    ax[i].legend()
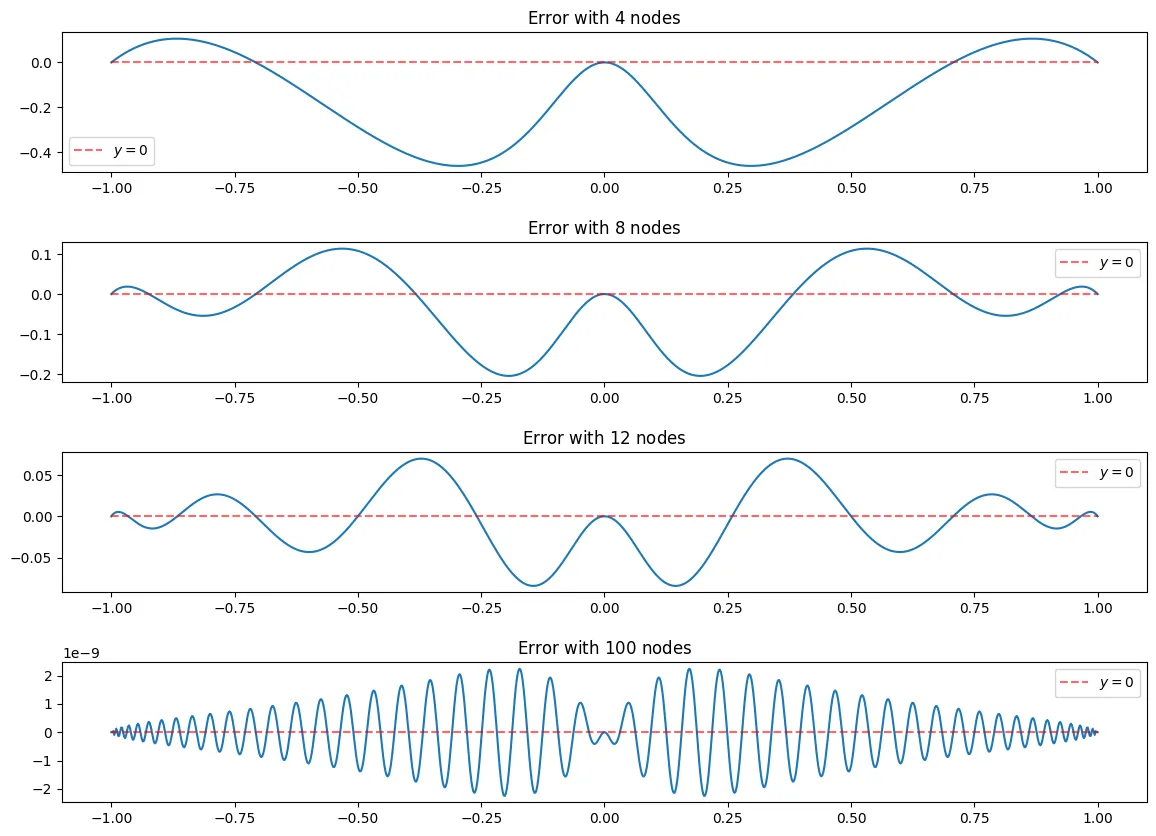
In the above graphs you see that the error is very small around which is what we would expect as seen in the graphs above, the chebyshev nodes tend to be very close to the function using Barycentric interpolation on the edges and the origin, however they tend to be farther in between the origin and the edges.
Another Test
For for
f_x = lambda x: (np.e)**(x**2)
N = [4,8,12]

fig, ax = plt.subplots(len(N),figsize = (14,10))
fig.subplots_adjust(hspace=.5)

for i, n in enumerate(N):
    x_j = equidist_x(n)
    f_x_j = f_x(x_j)
    l = EquidistantBaryWeights(x_j)
    B_n = BaryFormula(x_j, f_x_j, l = l)
    plotB_n(x_j, B_n, f_x, ax[i])

Here we can see that the equidistant nodes tend to be a very good approximation for the function. Even at nodes, the function seems to be very close, and even the error looks to be very small. As increases, we see it match the function pretty much perfectly. Below I will also plot the error which will reveal that the error is very small on this interval.
e_n = lambda x, f_x, B_n: f_x(x)-B_n(x)

N = [4,8,12]

fig, ax = plt.subplots(len(N),figsize = (14,10))
fig.subplots_adjust(hspace=.5)

for i, n in enumerate(N):
    x_j = cheby_x(n)
    f_x_j = f_x(x_j)
    l = EquidistantBaryWeights(x_j)
    n_e = 1000
    x_points = equidist_x(n_e)
    B_n = BaryFormula(x_j, f_x_j, l = l, vectorized=True)
    ax[i].plot(x_points, e_n(x_points, f_x, B_n), label = "error")
    ax[i].set_title("Error with $" + str(n) + "$ nodes")
    ax[i].hlines(0, -1,1,linestyle = "--", alpha = 0.6, color = "red", label = "$y=0$")
    ax[i].legend()
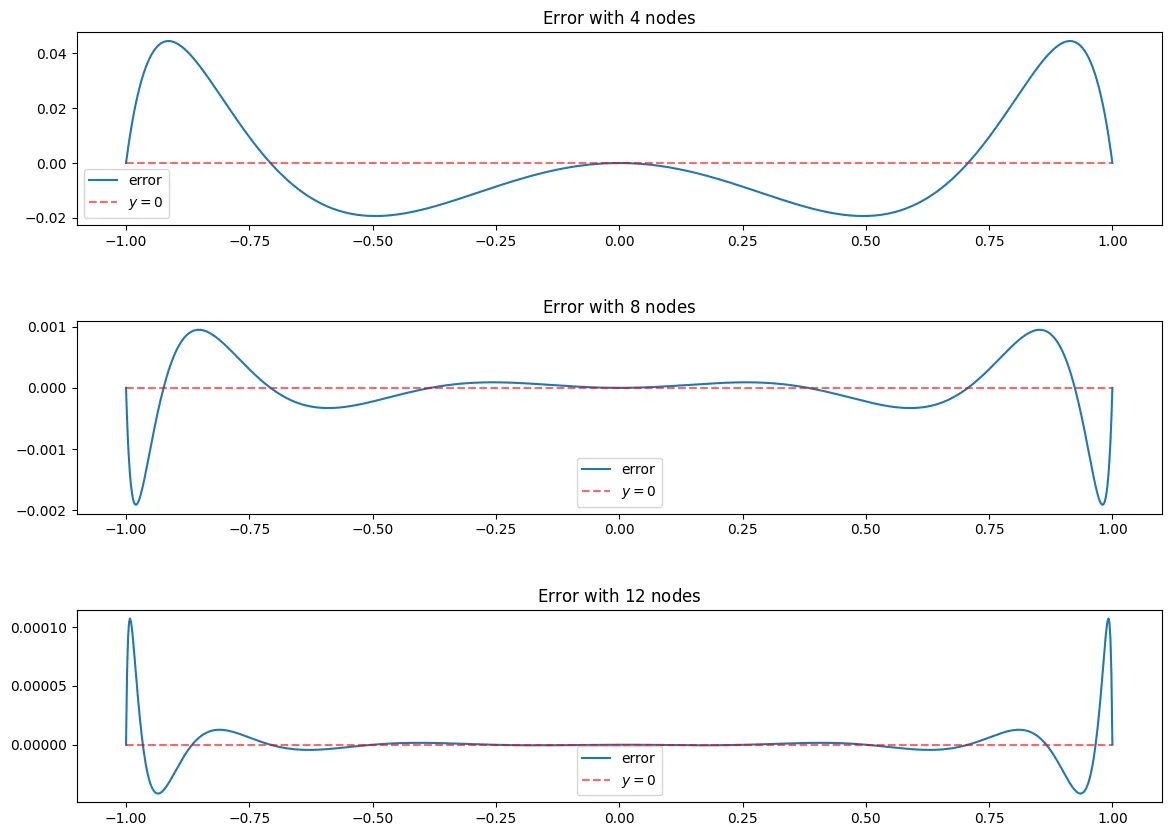
As seen above, the max error at nodes is about , that is very good for the low computation cost it took.